Get and set colours for plotting Raster* objects
setColors works as a replacement method or a normal function call.
This function can accept RColorBrewer colours by name. See examples.
Arguments
- object
A
Raster*object.- ...
Additional arguments to
colorRampPalette.- n
An optional vector of values specifying the number of levels from which to interpolate the colour palette.
- verbose
Numeric or logical. If
TRUEor>0, then messages will be shown. IfFALSEor0, most messages will be suppressed.- value
Named list of hex colour codes (e.g., from
RColorBrewer::brewer.pal), corresponding to the names ofRasterLayers inx.
Value
Returns a named list of colours.
Returns a Raster with the colortable slot set to values.
See also
setColors<-(), brewer.pal(), RColorBrewer::ColorBrewer
brewer.pal(), RColorBrewer::ColorBrewer,
colorRampPalette().
Examples
library(terra)
ras <- rast(matrix(c(0, 0, 1, 2), ncol = 2, nrow = 2))
getColors(ras) ## none
#> $lyr.1
#> character(0)
#>
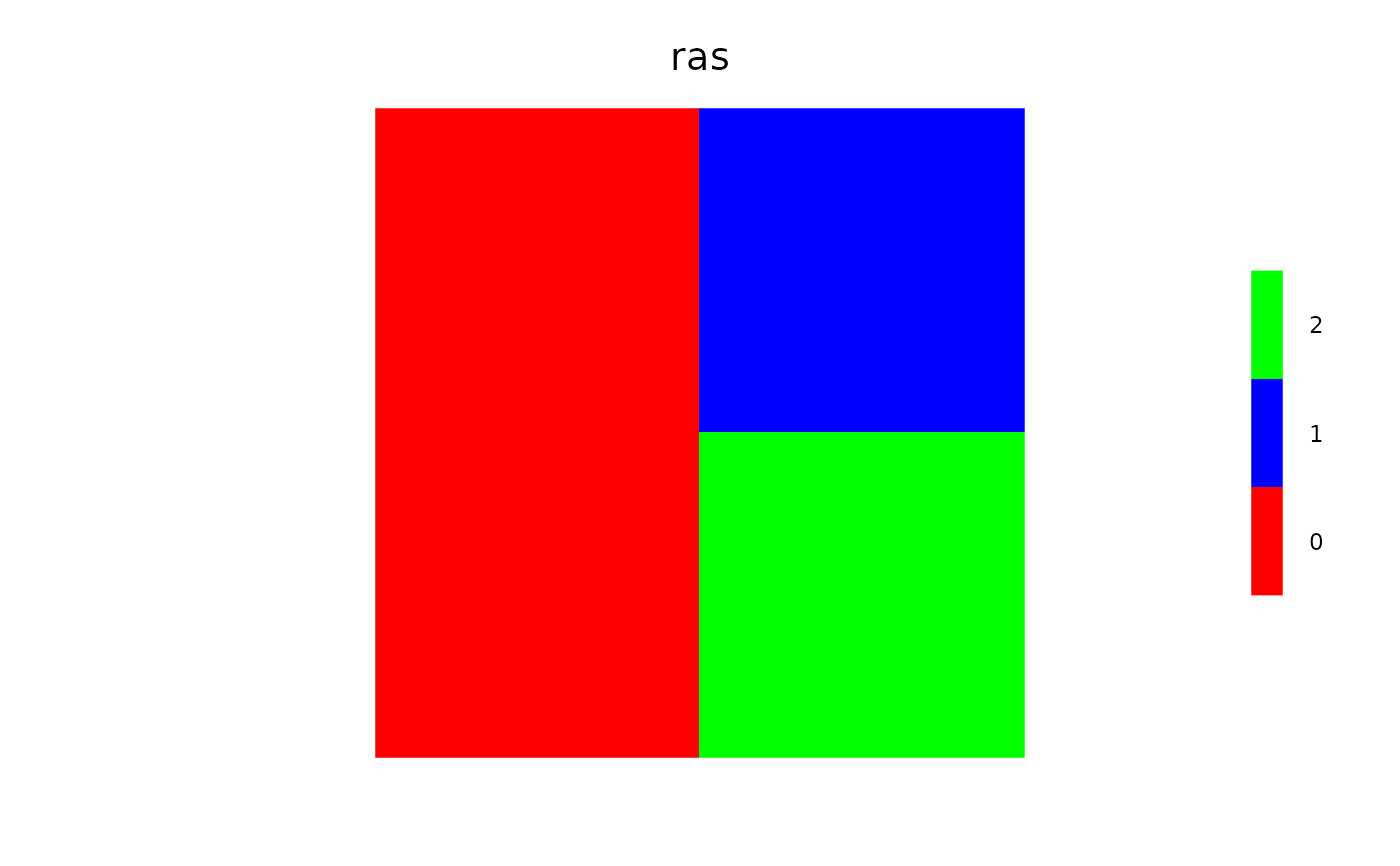
# Use replacement method
setColors(ras, n = 3) <- c("red", "blue", "green")
getColors(ras)
#> $lyr.1
#> [1] "#FF0000FF" "#0000FFFF" "#00FF00FF"
#>
clearPlot()
Plot(ras)
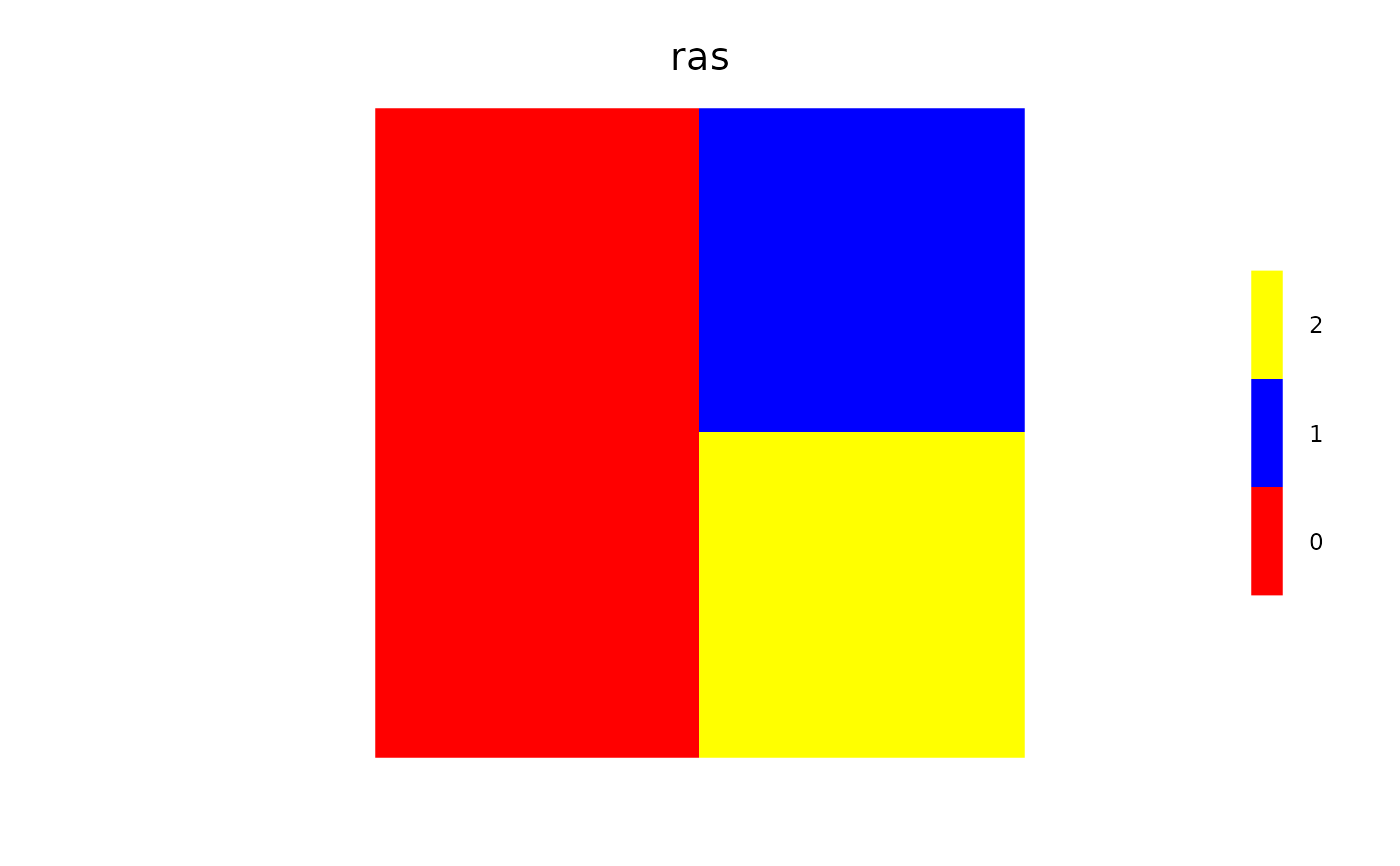
 # Use function method
ras <- setColors(ras, n = 3, c("red", "blue", "yellow"))
getColors(ras)
#> $lyr.1
#> [1] "#FF0000FF" "#0000FFFF" "#FFFF00FF"
#>
clearPlot()
Plot(ras)
# Use function method
ras <- setColors(ras, n = 3, c("red", "blue", "yellow"))
getColors(ras)
#> $lyr.1
#> [1] "#FF0000FF" "#0000FFFF" "#FFFF00FF"
#>
clearPlot()
Plot(ras)
 # Using the wrong number of colors, e.g., here 2 provided,
# for a raster with 3 values... causes interpolation, which may be surprising
ras <- setColors(ras, c("red", "blue"))
clearPlot()
Plot(ras)
# Using the wrong number of colors, e.g., here 2 provided,
# for a raster with 3 values... causes interpolation, which may be surprising
ras <- setColors(ras, c("red", "blue"))
clearPlot()
Plot(ras)
 # Real number rasters - interpolation is used
ras <- rast(matrix(runif(9), ncol = 3, nrow = 3)) |>
setColors(c("red", "yellow")) # interpolates when real numbers, gives warning
clearPlot()
Plot(ras)
# Real number rasters - interpolation is used
ras <- rast(matrix(runif(9), ncol = 3, nrow = 3)) |>
setColors(c("red", "yellow")) # interpolates when real numbers, gives warning
clearPlot()
Plot(ras)
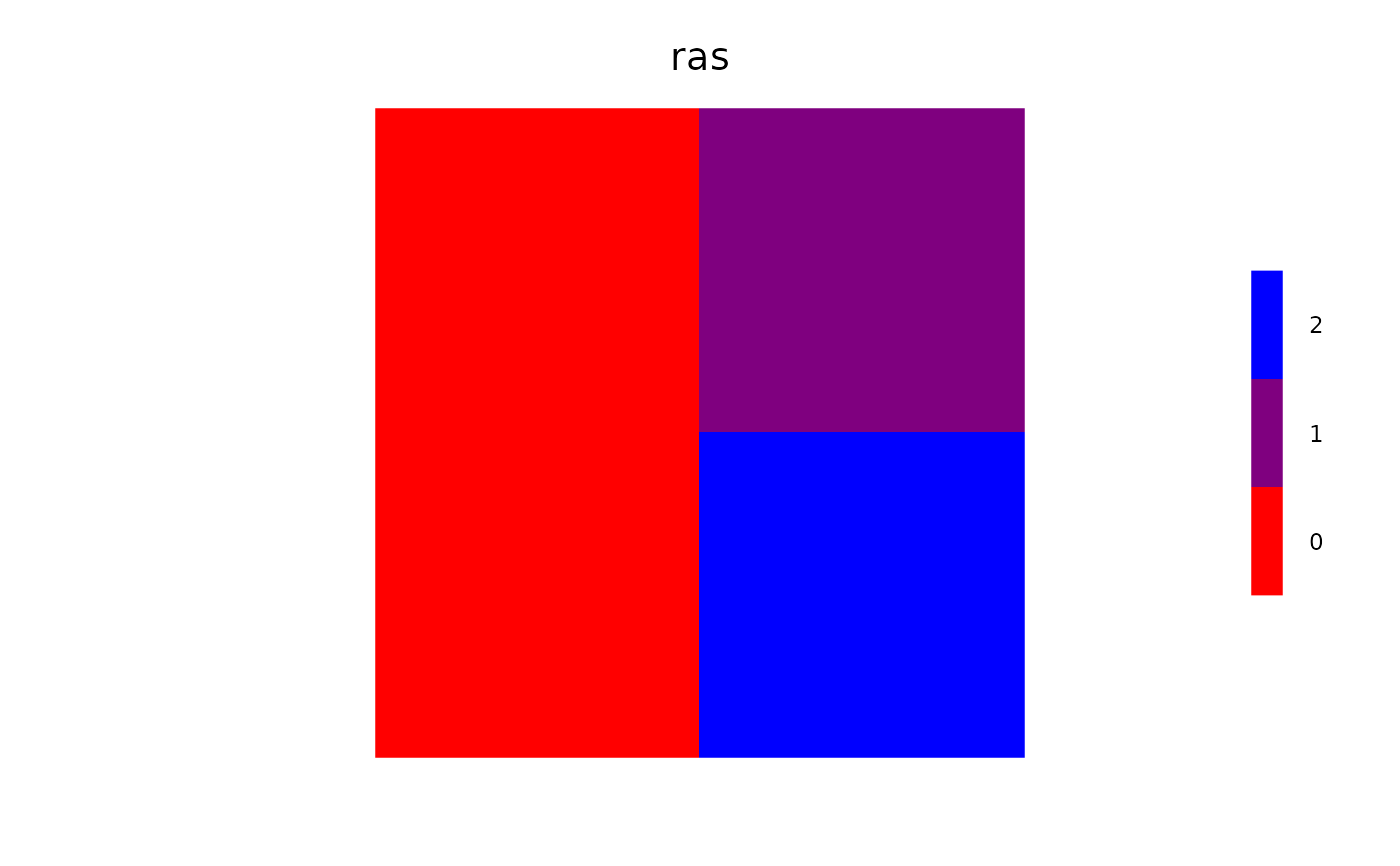
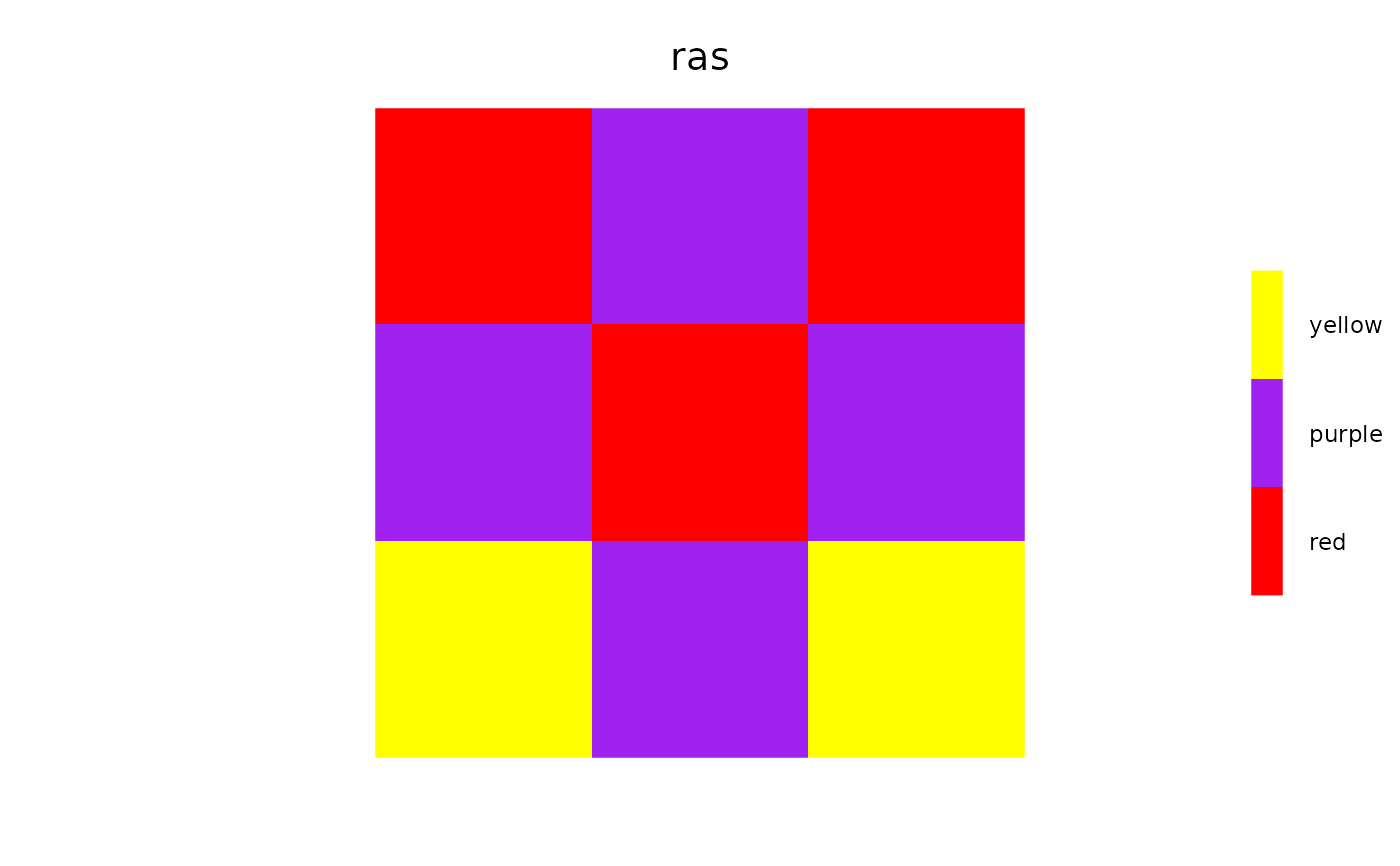
 # Factor rasters, can be contiguous (numerically) or not, in this case not:
ras <- rast(matrix(sample(c(1, 3, 6), size = 9, replace = TRUE), ncol = 3, nrow = 3))
levels(ras) <- data.frame(ID = c(1, 3, 6), Names = c("red", "purple", "yellow"))
ras <- setColors(ras, n = 3, c("red", "purple", "yellow"))
getColors(ras)
#> $Names
#> [1] "#FF0000FF" "#A020F0FF" "#FFFF00FF"
#>
clearPlot()
Plot(ras)
# Factor rasters, can be contiguous (numerically) or not, in this case not:
ras <- rast(matrix(sample(c(1, 3, 6), size = 9, replace = TRUE), ncol = 3, nrow = 3))
levels(ras) <- data.frame(ID = c(1, 3, 6), Names = c("red", "purple", "yellow"))
ras <- setColors(ras, n = 3, c("red", "purple", "yellow"))
getColors(ras)
#> $Names
#> [1] "#FF0000FF" "#A020F0FF" "#FFFF00FF"
#>
clearPlot()
Plot(ras)
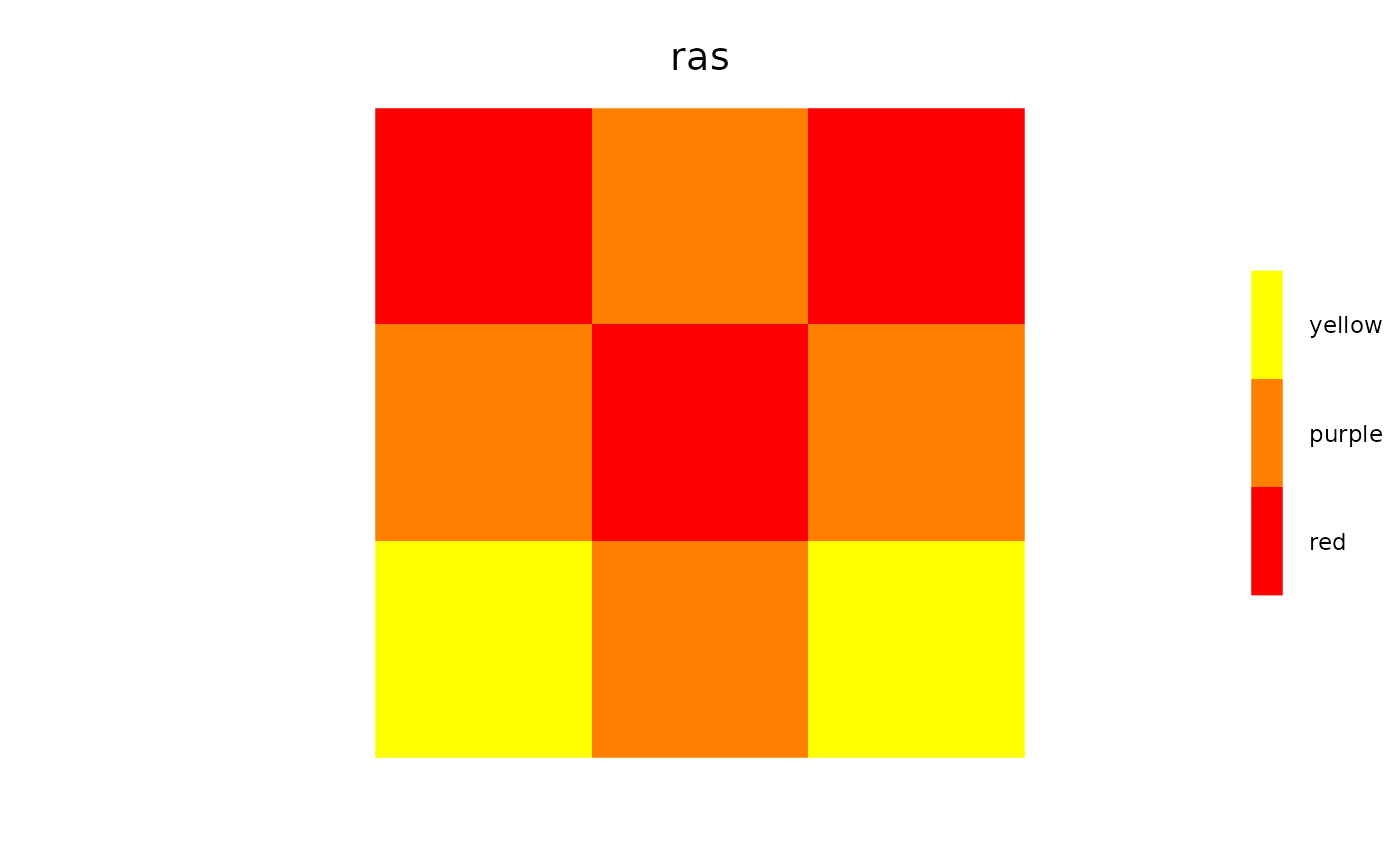
 # if a factor raster, and not enough labels are provided, then a warning
# will be given, and colors will be interpolated
# The level called purple is not purple, but interpolated betwen red and yellow
suppressWarnings({
ras <- setColors(ras, c("red", "yellow"))
clearPlot()
Plot(ras)
})
#> Number of colours not equal number of values: interpolating
# if a factor raster, and not enough labels are provided, then a warning
# will be given, and colors will be interpolated
# The level called purple is not purple, but interpolated betwen red and yellow
suppressWarnings({
ras <- setColors(ras, c("red", "yellow"))
clearPlot()
Plot(ras)
})
#> Number of colours not equal number of values: interpolating
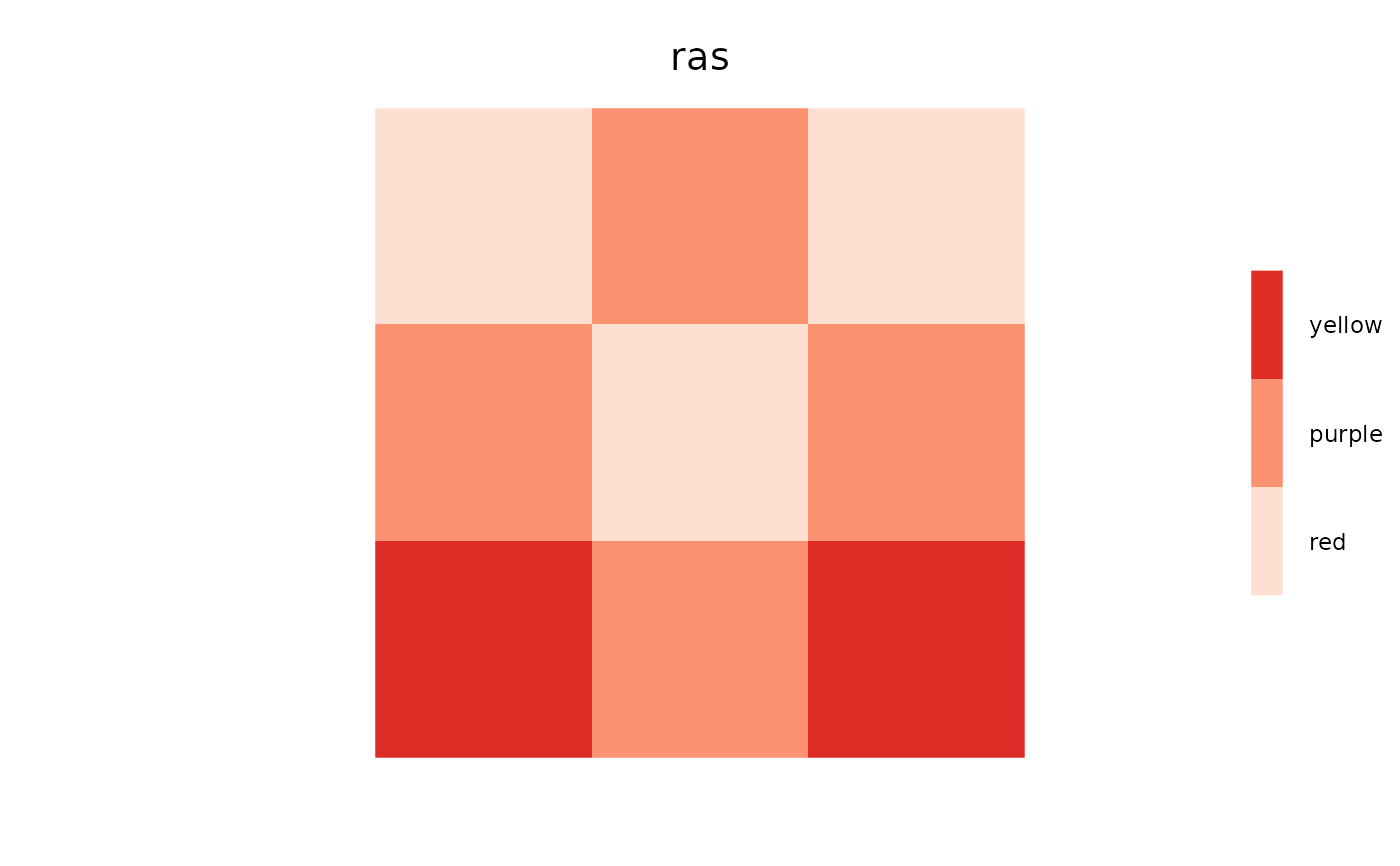
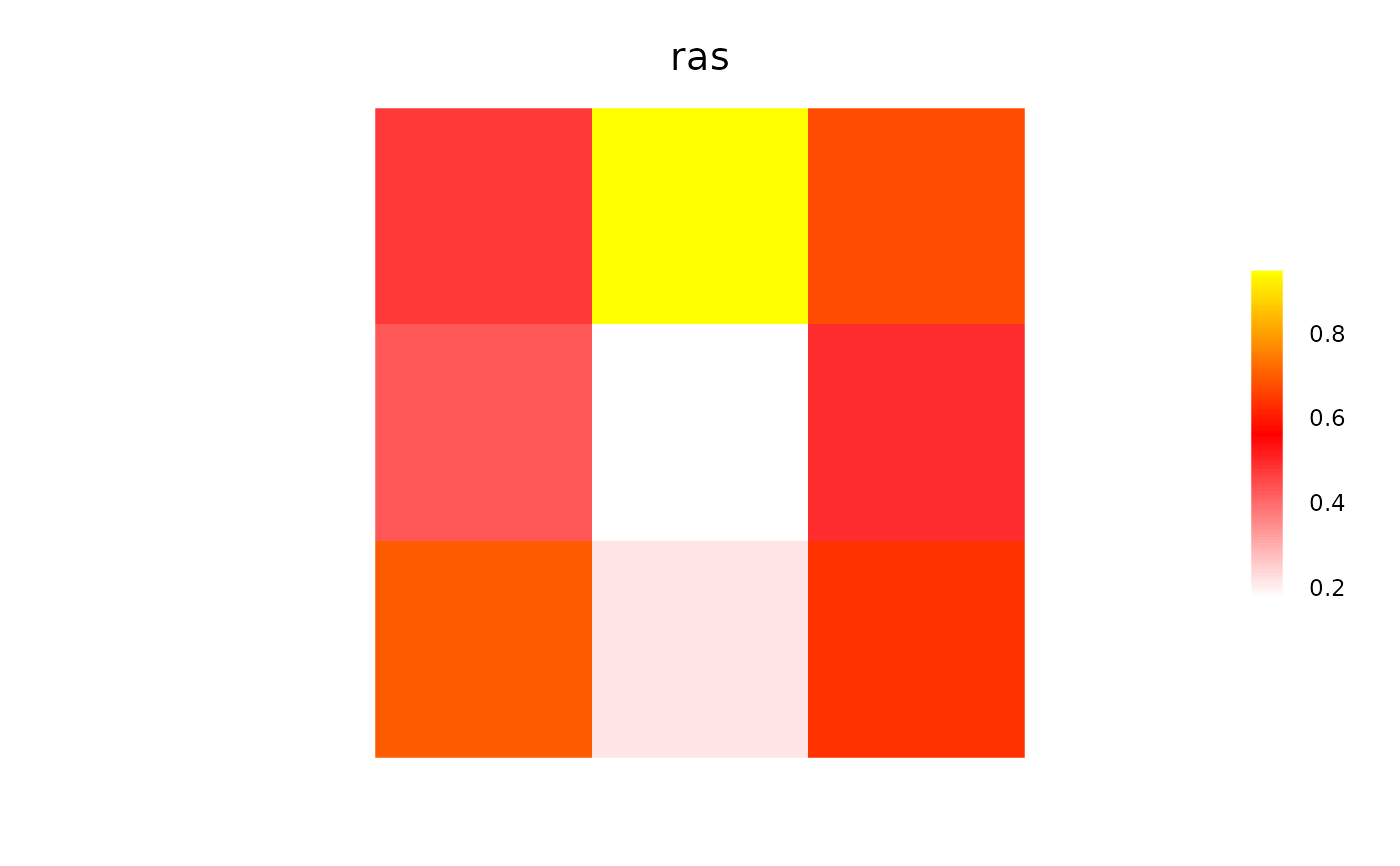
 # use RColorBrewer colors
setColors(ras) <- "Reds"
#> Number of colours not equal number of values: interpolating
clearPlot()
Plot(ras)
# use RColorBrewer colors
setColors(ras) <- "Reds"
#> Number of colours not equal number of values: interpolating
clearPlot()
Plot(ras)